
Campaign Analytics
The Campaign Analytics page allows merchants to evaluate the ROI (Return on Investment) of their marketing efforts. It provides a granular look at how customers interact with specific campaigns, from initial impression to final purchase.
Analytics Tabs
At the top of the analytics dashboard, users can toggle between different levels of data granularity:
Campaigns: The primary view (shown) providing high-level performance metrics for entire marketing initiatives.
Experiences: Data focused on the specific customer journeys or "flows" within campaigns.
Variations: Performance data comparing different versions of content (useful for A/B testing).
Widgets: Analytics specific to individual UI elements (e.g., carousels, pop-ups) used across campaigns.
Performance Metrics Table
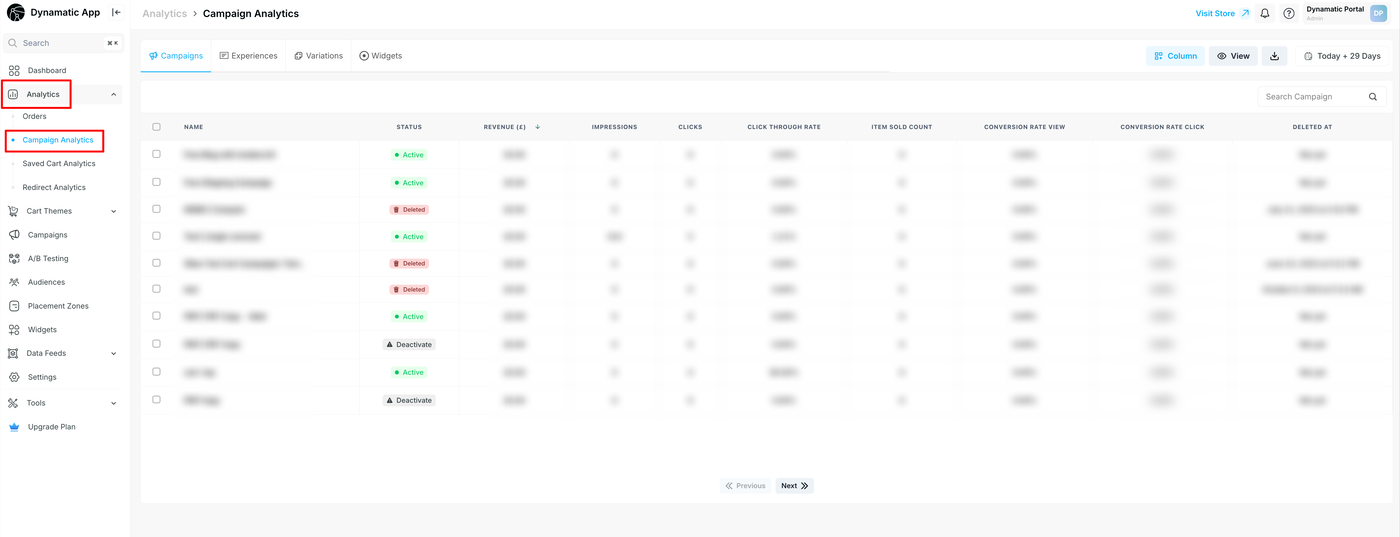
The table displays a variety of Key Performance Indicators (KPIs) to help you assess campaign health:
Column | Description |
Name | The unique title of the campaign (e.g., "Free Shipping Campaign"). |
Status | Indicates the current state: Active (Running), Deleted (No longer in use), or Deactivated (Paused). |
Revenue ($) | The total monetary value generated by orders attributed to this specific campaign. |
Impressions | The total number of times the campaign was viewed by users. |
Clicks | The number of times users interacted with or clicked on campaign elements. |
Click Through Rate | The percentage of impressions that resulted in a click (Clicks ÷ Impressions). |
Item Sold Count | The total number of individual products purchased through this campaign. |
Conversion Rate View | The percentage of users who purchased after simply viewing the campaign. |
Conversion Rate Click | The percentage of users who purchased after clicking a campaign element. |
Deleted At | A timestamp indicating exactly when a campaign was removed (shows "Not yet" if active). |
Management & Filtering Tools
The page includes several tools to help you organize and find specific data points:
Search Bar: Located at the top right of the table, allowing you to quickly find a campaign by its name.
Date Range Picker: Sets the window for the data displayed (currently set to "Today + 28 Days").
Column Customization: The "Column" button allows you to add or remove metrics from the table view.
View & Export: The "View" button adjusts the display layout, while the Download/Export icon (next to the date picker) allows you to export this data for external reporting.
Pagination: Located at the bottom, enabling navigation through multiple pages of campaign records.
Status Indicators
The app uses color-coded badges to provide at-a-glance status updates:
Green (Active): The campaign is currently live and collecting data.
Red (Deleted): The campaign has been removed. Historical data remains visible for reporting purposes, but no new data is being collected.
Grey (Deactivate): Campaigns that have been manually stopped but not permanently deleted.