
Theme Testing
A Theme Test allows you to run an A/B test where your store's traffic is split between two different Shopify themes. The entire site experience changes depending on which variation of the test a particular user is assigned to.
Common Use Case: You have been using your current theme for a long time, and you’ve decided to try a new theme. You might be worried about negatively impacting site performance and conversion rates. Before making the new theme fully live, you can run a Theme Test to see exactly which theme performs better overall.
How it works behind the scenes
Shopify only allows one theme to be "Live" at a time. To bypass this, Dynamatic automatically appends a secure preview URL parameter for users assigned to the test group. Dynamatic then uses cookies to ensure the user stays on the correct version of the site for the duration of the test.
Note: Dynamatic automatically hides the default Shopify "Preview" bar at the bottom of the screen, ensuring your test group gets a seamless, native browsing experience.
Prerequisites
Before you begin, ensure that the Dynamatic App Embed extension is enabled in the Shopify Theme Editor for both the Control theme (your live theme) and the Test theme (your draft theme).
Step 1: Setup (Metrics, Audience, & Schedule)

Navigate to the Setup experiment page in Dynamatic and complete the initial configurations.
1. Choose Metrics
Select the primary metric you want to use to determine the success of your test.
Revenue: Declares a winner based on the highest total sales dollars generated.
Conversion: Declares a winner based on the highest percentage of users who complete a purchase.
Profit: Declares a winner based on the highest total profit.
2. Select Your Audience
Choose who will be included in this experiment. You can stick to Common settings or build Advanced rules.
Common: Quickly filter by Device Type (All Devices, Desktop, Mobile, Tablet) or Visitor Type (All Visitors, New, Returning).
Advanced / Create Audience: Click Create new audience to open the advanced builder. Here, you can name your audience, add labels/notes, and define specific logic based conditions. For example, you can target users based on their Time on site using AND / OR rules.
3. Set the Schedule
Determine when your test will run.
From: Select the start date and time.
To: Select an end date, or simply check the "This experience never expires" box to let the test run indefinitely until you manually stop it.
Ensure your Timezone is set correctly.
Click Save & Next to proceed.
Step 2: Select Themes & Traffic Allocation

In the Select themes tab, you will assign your themes and decide how much traffic goes to each.
1. Assign Themes to Variations
Control: This is usually your current Live theme. Click Select a Theme to choose it from your Shopify theme library.
Test A: This is your draft theme. Click Select a Theme to choose the draft theme you want to test against the Control.
2. Allocate Traffic
Use the slider under each variation to determine the percentage of visitors that will see each theme.
For a standard A/B test, a 50% / 50% split is recommended.
You can use the Split Allocations checkbox to evenly distribute traffic automatically, or use Lock/Unlock Allocations if you are testing multiple variations and want to freeze the traffic percentage on a specific theme.
Dynamatic Recommendation: > When you end or pause a theme test, we strongly recommend keeping all themes used in the test installed in your Shopify admin for at least one month. This helps ensure accurate tracking for returning visitors and prevents any issues with your store's data.
Click Save & Next to proceed.
Step 3: Review & Publish

The final step is to review your experiment settings before setting it live.
Review your Summary: Check the summary cards at the top of the page. Ensure your Audiences, Themes, Metric, and Duration are configured exactly as you want them.
Variant Split: Review the visual timeline to confirm your traffic allocations (e.g., Control 50%, Test A 50%)
Publish: If everything looks correct, click the blue Publish button in the top right corner to start your test. If you aren't quite ready, you can click Save as Draft to come back to it later.
At the top of the details page, you will find a quick snapshot of your fundamental test settings:
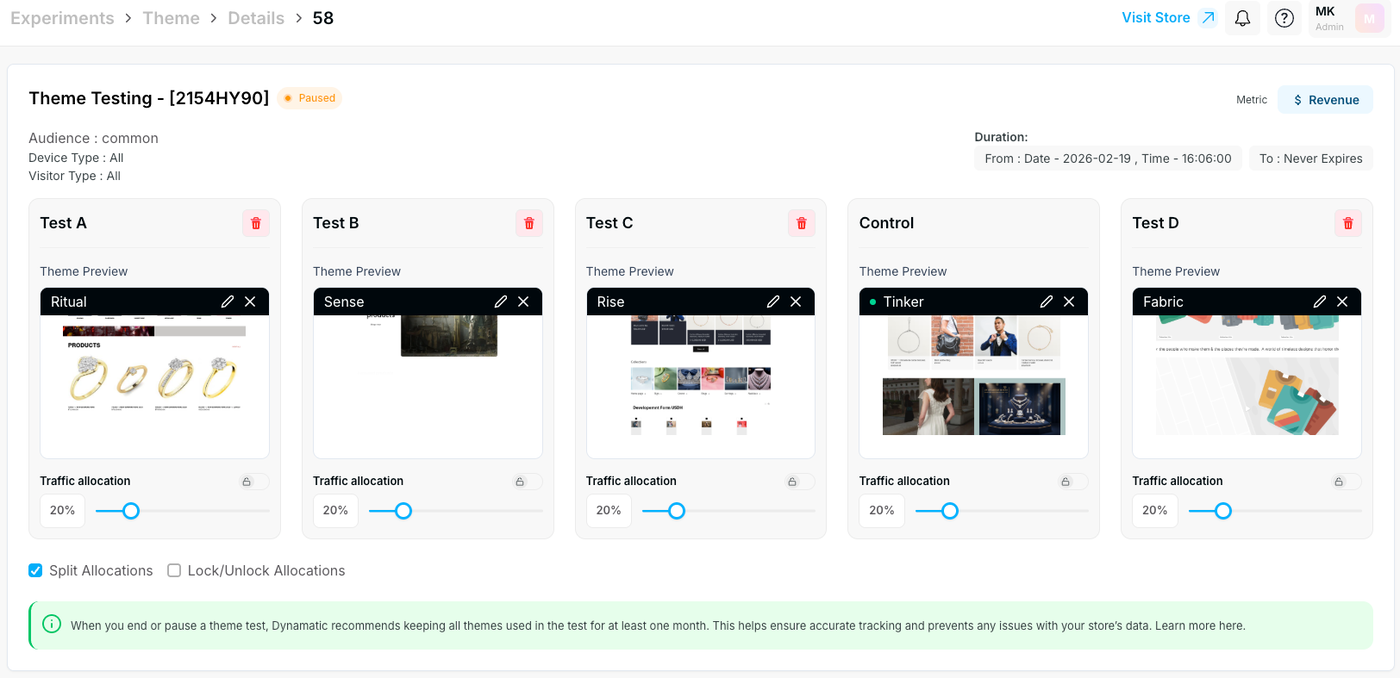
Test Name & Status: The name of your test (e.g., "Theme Testing - [2154HY90]") is displayed at the top left, alongside its current status, such as an orange "Paused" badge.
Targeting Rules: Just below the title, you can review the selected Audience (e.g., common), Device Type (e.g., All), and Visitor Type (e.g., All).
Duration & Metric: The top right corner shows your chosen primary goal (e.g., Revenue) and the exact duration of the test, including the start date, time, and end date (e.g., To: Never Expires).
The main section of this page displays a series of individual cards for every theme included in your A/B test:
Theme Previews: You will see a dedicated card for your Control theme (e.g., Tinker) and all additional test variants (e.g., Test A - Ritual, Test B - Sense, Test C - Rise, Test D - Fabric). Each card includes a small visual preview of the associated theme.
Traffic Sliders: Each variant card features a traffic allocation slider displaying the percentage of traffic routed to that specific theme (e.g., 20% for each variant in a five-theme test).
Allocation Controls: Below the variant cards, you can check the "Split Allocations" box to automatically divide your store traffic evenly across all themes. There is also an option to "Lock/Unlock Allocations" if you need to freeze specific traffic percentages.
Dynamatic Recommendation: As noted in the green banner at the bottom of the screen, when you end or pause a theme test, Dynamatic recommends keeping all themes used in the test installed for at least one month. This helps ensure accurate tracking and prevents any issues with your store's data.
Analyzing Your Theme Test Results

1. Experiment Overview & Variant Cards
At the top of the dashboard, you will find the high-level summary of your experiment, including the test name, its current status (e.g., "Paused" or "Running"), the date duration, and your chosen primary Metric (e.g., Revenue).
Directly below the summary, you will see individual performance cards for each theme variation in your test (e.g., Control, Test A, Test B, Test C). Each card displays:
Traffic distribution: The actual percentage of visitors routed to that specific theme.
Visitors: The total number of unique users who saw that theme.
Conversion Rate: The percentage of those visitors who made a purchase.
Total Revenue: The total sales dollars generated by that specific theme.
Confidence: The statistical confidence level of the results.
Winner Badge: Once the app gathers enough conclusive data, it will automatically highlight the best-performing theme with a green Winner badge.
2. Core KPIs (Measure Success)
The Measure Success tab gives you a quick snapshot of the most critical store metrics. These aggregate boxes show your overall performance and indicate how it compares to your baseline:
Total Revenue: The total monetary value of all orders placed during the test.
Conversion Rate: The overall percentage of visitors who successfully checked out.
AOV (Average Order Value): The average amount spent by customers per transaction.
3. Data Visualizations & Charts
To help you spot trends quickly, the dashboard provides several interactive charts:
Revenue Analysis: A comparative chart displaying revenue across all your variants. You can use the toggle in the top right of this card to switch the view to RPV (Revenue Per Visitor).
Order Histogram: A chart breaking down order volume across the test groups. You can toggle this card to view AOV trends.
% of Traffic: A donut chart visually confirming how your visitor traffic was distributed among the themes.
Revenue by device: A visual breakdown showing which devices (e.g., mobile vs. desktop) are driving the most revenue across your themes.
4. Top Selling Items
At the bottom of the page, the Top selling items table provides granular product-level data. It lists the specific products sold during the experiment and displays their respective Orders, Revenue, and AOV. This is particularly useful for seeing if a new theme layout positively influences the sales of specific products or collections.